

This is a subject that came to me recently through several conversations with professionals in the equity market, as well as from listening to various finance podcasts. We are letting ourselves drown in information, lowering our signal-to-noise ratio and negatively impacting our decision-making.
What is the curse of dimensionality?
I first came across the topic when I was working on quantitative trading strategies at my former employer. In my early days (2010–2015) applying quantitative methods to markets, I used the usual beginner techniques—walk-forward backtesting across many parameters—which inevitably led to obvious overfitting. On the positive side, I was neither naïve nor careless enough to fall for it, so it never led me down a dangerous road.
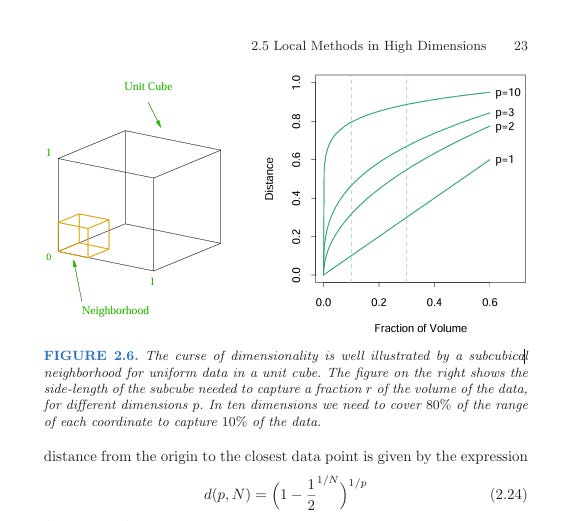
Around early 2016, I became much more interested in machine learning (ML) and dedicated a great deal of time to this subject over the subsequent 7 years. It was then that I came across the curse of dimensionality in the famous book The Elements of Statistical Learning: Data Mining, Inference, and Prediction by Hastie, Tibshirani, and Friedman. While the concept was new to me in 2016, it was actually first described by Bellman in 1961.
The curse of dimensionality refers to the phenomenon that as you increase the number of variables (or “features” in ML language), the volume of high-dimensional space grows very rapidly, causing data density to decrease just as quickly. Sparse data in “local pockets” of a dataset leads to breakdowns in distance-based algorithms and makes similarity much harder to infer.
In self-driving car technology, the curse of dimensionality shows up as “edge cases.” You might increase total data points by 10x, but 99.98% of these new points fall within already high-density regions of the high-dimensional space. These additional points add very little value to the model. Accidents happen in edge cases where data is sparse and statistically difficult to collect. Unfortunately, it is precisely in these edge cases that traffic accidents tend to occur.
So how is it that current AI systems, such as large language models (LLMs), can overcome the curse of dimensionality in language and images?
The reason the latest generation of AI models (LLMs) appear to have “solved” many of the challenges posed by the curse of dimensionality is that real-world data such as language is highly structured. More importantly, deep learning neural networks leverage the clever transformer architecture by embedding textual data into dense, high-dimensional vector spaces (called token embeddings). This process makes it easier for the model to capture similarities and complex relationships.
In general machine learning, outside LLMs, the solution is often to apply feature reduction, which transforms a high-dimensional dataset into a lower-dimensional one while preserving as much predictive power as possible. This is what data scientists do with tabular datasets in a business context—for example, to gain insights into client retention or other key metrics of interest.
How does the curse of dimensionality appear in finance and equity investing?
Why is a statistical learning concept relevant for equity investing and business professionals in general?
Unless you have some training and understanding of these concepts, it’s easy to fool yourself into believing that more variables and more data points will automatically improve decision-making. Nothing could be further from the truth. I know businesses with hundreds of dashboards tracking all sorts of variables. Does this lead to better decisions? Does it create more shareholder value? I have my doubts.
More data and variables increase complexity, overwhelm our cognitive capacity, and often lead to confusion or misinterpretation. Too often, what we observe is noise rather than signal. This is why my 7 years of training ML models taught me crucial lessons about simplicity and feature reduction—lessons that now guide how we approach fundamental equity investing at Gesda Capital.
I frequently come across equity analysts or portfolio managers with endless spreadsheets and indicators. This can provide a false sense of comfort, as if the subject is better understood. Perhaps it is our own insecurities that drive this behavior. If we reduce things to their ultimate simplicity, will people accuse us of being naïve or of not having done enough work?
What many fail to recognize is that the prediction error—whether in weather forecasting, business performance, or investing—grows rapidly with the forecasting horizon. Because of the curse of dimensionality, adding more indicators or spreadsheets does not meaningfully reduce prediction error. In reality, many investors are wasting valuable time without improving their outcomes.
Causality and Fundamental Equity Models
The insights from the curse of dimensionality—especially in a noisy data space like equity markets—together with the book The Book of Why by Pearl and Mackenzie, shaped a key decision in my life. I chose to move away from applying machine learning in investing, as much of it relies on detecting weak correlation patterns in data with the expectation that they will repeat in the future. Many quantitative firms are skilled at this, and the market has become highly efficient when it comes to ML-driven techniques.
By contrast, fundamental equity investing and business valuation face a different challenge. Over the past 15 years, around 90% of active equity managers have underperformed their benchmarks. This is where the real problem in investing lies, and with the continuous rise of passive index investing, it is only getting worse. This is what I set out to change. The equity market benefits from having different types of participants, and at Gesda Capital we want to demonstrate that fundamental active equity managers can deliver real value.
In The Book of Why, Pearl highlights the key differences between causal relationships and spurious correlations. The science of causal inference is essential and is beginning to influence quantitative investing in new ways. For me, it provided a path back to my earlier passion for fundamental equity valuation. Combined with the toolkit from Michael Mauboussin, it allowed me to see things from a fresh perspective.
The strength of fundamental equity investing is that a business can be valued using a small set of core causal variables: revenue growth, operating margin, reinvestment rate1, tax rate, and cost of capital. At the most abstract decision-making level, this framework simplifies things greatly. Of course, each of these variables is shaped by underlying causal drivers that must be deeply understood; this is where complexity inevitably re-enters the process.
At Gesda Capital, our equity research work is guided by a focus on balance. We strive to use enough variables to support sound decisions, but not so many that we risk confusion or the curse of dimensionality. One final variable stands apart as critically important: the management team.
At the end of the day, investors entrust capital to Gesda Capital because they believe in our investment process. We allocate this capital to companies run by management teams who, in turn, make vital capital allocation decisions. Combined with the competitive advantages of a business, these choices generate long-term value for shareholders. Since we never have complete information and prediction error grows with the forecasting horizon, the ability of a management team to navigate uncertainty plays a defining role in shareholder value creation—and ultimately in our success as equity investors.
The image used for this publication on Garnry Investments is from Unsplash and taken by Suganth
The reinvestment rate is probably the most overlooked variable by many investors and a subject I will come back to in the future
Hi Peter, is there a way to invest with Gesda? I tried the website but it’s only in Danish which I do not master 😀
I completely agree! And would add that most valuations in young firms would be greatly improved if 90% of the time was used at forecasting growth and reinvestment.