The return machine
How to think about yields, growth, and mean-reversion

I was recently invited as a speaker for a group of investors and during the Q&A a person asked how investors should think about Novo Nordisk. What was the business outlook, and should he sell his shares or buy more?
This piece is my attempt to answer that question by using what I call the “return machine”, which is a simple framework that connects today’s free cash flow yield, future free cash flow growth, and changes in valuation to long-term expected returns.
A simplified return machine
John C. Bogle, the founder of Vanguard Group and originator of the first index fund, was famous for highlighting a simplified expression of expected long-term returns: current earnings yield, plus future earnings growth, plus or minus the change in the earnings yield.
As readers of these writings will know, I find little value in earnings and P/E ratios as they exclude the reinvestments needed to grow the business. As a result, it is more meaningful to substitute accounting earnings with free cash flows, which are the only real figure available to investors as they can be used for dividends, share buybacks, paying back debt, or increasing excess cash reserves.
In free cash flow terms, the “return machine” can be thought of as:
As will be clear in our subsequent examples, the superior long-term outcome can be dominated by any of these three factors. No one is inherently better than the others, as “all roads lead to Rome”.
If we momentarily exclude the last term, which is essentially whether investors in the future are willing to pay a higher or lower valuation multiple (the inverse of the FCF yield), then we can see why turmoil and falling stock prices were delightful events for Warren Buffett. In times of crisis or abrupt change like the software crash in February or the war in Iran, investors panic and sell stocks, even the highest quality companies.
What happens in a crisis is that the FCF yield increases. If the business performance remains satisfactory and the structural long-term growth potential of the business is not impaired, then the long-term expected return goes up.
How to think about value and growth stocks
To understand how this works, and why a richly valued growth stock can end up with the same long-term return as a low-growth “value” stock, we need to look at some examples.
Example 1: An aggressively priced growth stock
The first example is an aggressively priced US growth stock such as Palo Alto Networks, which is the largest cyber security company in the world. It is valued at a 1.1% free cash flow yield on a 12‑month forward basis. Let us assume that over the next 10 years, free cash flows can compound at 25% annualised, driven by expanding operating margins and revenue growth compounding at around 15% annualised.
By the end of the decade, we assume the FCF yield has slowly reverted back to the market average. The market-cap-weighted free cash flow yield was 3.1% in February for the MSCI World Index. If the company can realise this path over the next 10 years, that translates into a 14.2% annualised return. The end value after 10 years is the sum of all realised FCF during the period plus the expected value of the company in year 10. If it were not for the FCF yield increasing to 3.1%, the returns would have been staggering 25.6% annualised.
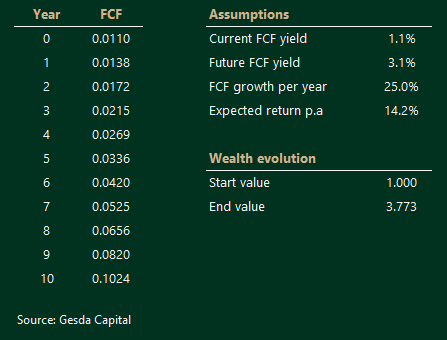
So the lesson here with aggressively priced growth stocks is that future growth must be very high, and that the change in the valuation multiple is really important for the long-term return and, in this case, is a drag on long-term returns. In theory, this company could end this 10‑year bull run in FCF with growth slowing dramatically and the FCF yield increasing to 6%. In that scenario, we would have had a company growing FCF by 10x, but only have had annualised returns of 8.1%, which is on par with long-term equity returns.
Example 2: A classic “value” stock
The second case is very different. This is a classic value stock1 valued at an 11% FCF yield, which is effectively a valuation reflecting negative FCF growth expectations2. Over the next 10 years, this company realises 3% annualised FCF growth, which is a positive surprise relative to the current expectations. As a result, the FCF yield declines to 6% by the end of the 10‑year period. The net result is a 14.5% annualised return.
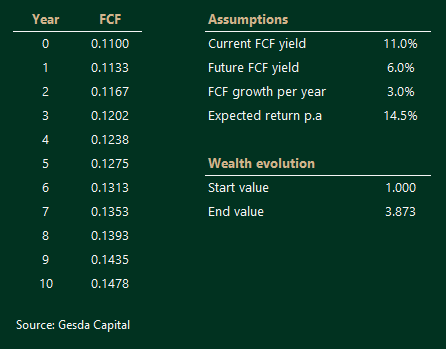
So this low-growth company ends up delivering the same annualised return to its shareholders as the high-growth company. The majority of the value creation comes from the high starting income (FCF at year zero) growing slowly and then a significant revaluation at the end of the period.
Buffett and extreme mean reversion
In the piece, The most famous snowball, we explore the incredible returns of Warren Buffett, and one of the main points is that his early track record had a lot of valuation mean-reversion effects.
Let us say he found a stock at a 30% FCF yield in the 1960s. Even with modest FCF growth at only 6% annualised (basically around nominal GDP growth) and a mean reversion to a 6% FCF yield, that stock would generate 29.7% annualised. In Buffett’s case he often held those stocks for a much shorter period, so the mean reversion in yield was not always as extreme, but because of the compressed time period and the ability to recycle capital into new high-yield opportunities, the annualised returns could often be more than 40%.
The overall lesson from these examples is that a “growth” stock can turn out to be “value”, and that stocks can generate roughly the same return with wildly different growth and valuation paths. All roads, in that sense, lead to the same return “Rome”.
The return machine applied to Eli Lilly vs Novo Nordisk
Now we can return to the original question I was asked about Novo Nordisk and show why understanding expectations and the return machine is so important for an investor.
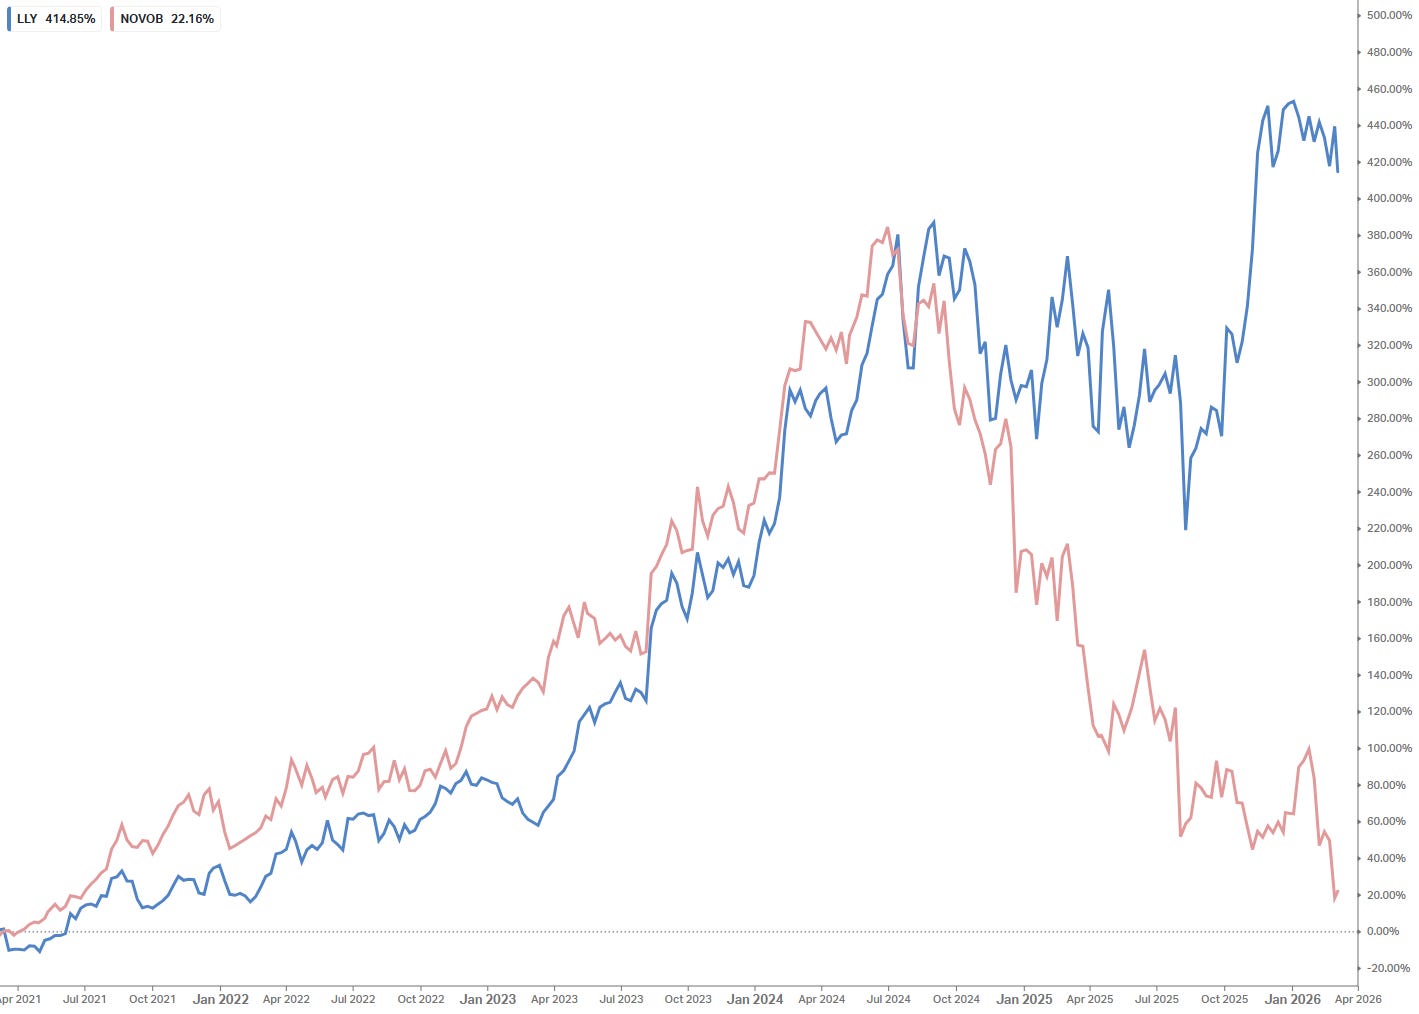
We all know that the narrative is extremely negative on Novo Nordisk3 and management to some extent has completely lost its control over the growth narrative. This is quite visible in the total return chart of Eli Lilly and Novo Nordisk. But investing is about the future, and by using the return machine, we can translate today’s prices into an implied set of expectations and compare them.
Novo Nordisk
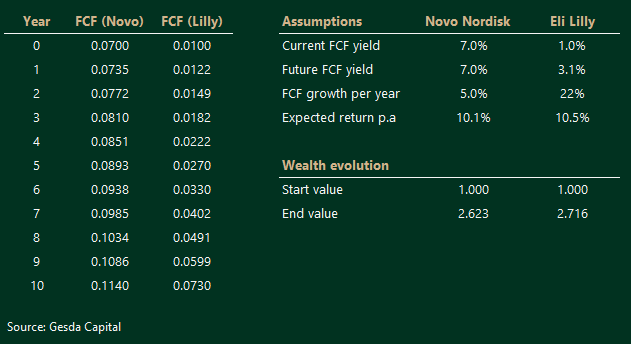
Let us start with Novo Nordisk. It is roughly valued at a 7% FCF yield, implying almost zero growth going forward. If we assume that the FCF yield remains unchanged 10 years from now and the company manages to grow FCF by just 5% annualised (on par with global nominal GDP growth, so essentially zero real growth), then the annualised return is 10.1%.
You can think of this as: “today’s income” of 7% plus 5% FCF growth with no change in the valuation multiple.
Eli Lilly (reverse‑engineered)
The Eli Lilly case is structured a bit differently and here we will apply some reverse engineering. Eli Lilly is valued at around a 1% FCF yield. If we expect the FCF yield to mean revert back to the market average after 10 years at 3.1% (the FCF yield in MSCI World as of February 2026), we can then ask: what FCF growth is required for Eli Lilly to generate the same 10.1% annualised return as in our Novo Nordisk assumption?
As the return machine below shows, the FCF growth must be 22% annualised to offset the lower starting income level and the drag from the valuation multiple reverting back to the market average.
In other words, the market is effectively saying: “Novo Nordisk is done growing; Eli Lilly will grow free cash flow ~22% a year for a decade and end up only on a market-average FCF yield.”
Eli Lilly vs Novo Nordisk
The enterprising and long-term investor now has something concrete to calibrate the investment decision on. One natural question is: how realistic is it that Eli Lilly will grow FCF at a 17‑percentage‑point annualised excess over Novo Nordisk for 10 years?
We can also ask what happens if trust is just somewhat restored in Novo Nordisk. If the FCF yield declines from 7% to, say, 5% over the period, then the implicit growth burden on Eli Lilly investors becomes even bigger. The differential growth that Eli Lilly needs to deliver to justify today’s relative pricing increases further.
Is that even possible? Over the past 20 years, Eli Lilly has grown revenue by 7.7% annualised versus 12.4% annualised for Novo Nordisk. The future may look very different, but the long-term history does not suggest that one of these companies is able to sustain an excess long-term annual growth of 17 percentage points over the other.
I am not saying it is impossible for Eli Lilly to deliver this outcome, only that the probability of it doing so, while also outgrowing Novo Nordisk by such a margin for a full decade, is low. Understanding this gap between implied expectations and historical reality is exactly what the return machine is designed to highlight.
What the framework leaves out
All of the examples above are simplified because the return machine is a simplified framework. Underneath, there are many variables like capital allocation decisions, quality of management, the product pipeline, the business model and strategy, regulatory risk, and competitive dynamics that go into the overall decision-making.
So the idea with the return machine is not to replace fundamental analysis, but to understand what FCF growth is needed for X annualised returns over a long period given the current FCF yield and an assumption about the future valuation multiple. Once you have that, you can then judge, as an investor, whether those implied expectations look modest, fair, or wildly optimistic.
The image used for as the front cover for this piece was taken by Luca J and is available on Unsplash here.
Disclaimer: This publication is for informational and educational purposes only and does not constitute investment, legal, tax, or other professional advice. Nothing in this article is a recommendation to buy, sell, or hold any security or to pursue any investment strategy, and it does not take into account your individual objectives, financial situation, or needs. You should conduct your own research and consult with a licensed professional adviser before making any investment decisions. All investing involves risk, including the possible loss of principal, and past performance is not indicative of future results. The views expressed are solely those of the author and may change without notice; they do not represent the views of any entity with which the author is affiliated
I personally don’t like this label as I would argue that our growth stock example shows, that a richly valued growth stocks can be “value” if the future realised path leads to long-term returns above the market.
The simple intuition here is that the broad stock index return 8-9% annualised long-term, so if a company is valued at 11% FCF yield and can keep this FCF for 10-years with zero net new investments it generates 2-3% outperformance annualised. Since markets are supposedly efficient, that cannot hold as there is “no free lunch” in investing. In a rational world, the only logic is that the market is expecting negative FCF growth so that the expected long-term return gets closer to the market return. I’m ignoring here the concept of higher risk equals higher return. It could be that the 11% FCF yield simply reflects higher business risks.
Novo Nordisk is a holding in an equity fund that Gesda Capital is investment advisor for.