


Is Palantir just another tulip bubble?
When expectations detach from reality

Palantir is the perfect case to illustrate the equity valuation process and demonstrate how expectations are a fundamental part that drives future returns. I have talked a lot in my earlier publications about free cash flow and how inversion can be used to tease out expectations to guide you as an investor. It has probably been somewhat abstract, but today we will go deep with a real case. Palantir is the company with the highest expectations for future growth that I have ever seen.
Palantir’s history: The short version
Palantir Technologies was founded in 2003 in Palo Alto, California, by former PayPal employees, Peter Thiel, Alex Karp (the current CEO), Joe Lonsdale, Stephen Cohen, and Nathan Gettings. It received early funding from In-Q-Tel, the CIA's venture capital arm, signaling its focus on government and intelligence applications. The early years were challenging, but in 2005, the CIA became a client, opening doors to other US government agencies.
The first major product, Palantir Gotham, launched in 2008, targeting government agencies for data integration, analysis, and visualization. By 2010, the U.S. government made up about 70% of Palantir’s business, with clients including the CIA, FBI, and NSA. In 2009, Palantir signed its first private-sector client, JPMorgan Chase, marking its expansion beyond government contracts. The company introduced Palantir Metropolis in 2010, a platform tailored for commercial clients in industries like finance and healthcare.
In 2014, the company’s annual revenue reached USD 1 billion, up from USD 450 million the previous year. Expansion continued, leading to Palantir’s IPO in late 2020, just as retail investor fever hit equity markets. In the past 12 months, revenue has been USD 3.1 billion. 2023 was its first fiscal year with a positive operating income. It took 20 years to break even. Not exactly the typical Palo Alto turbo growth we have seen so many times.
The operating system for the modern enterprise
As the title of this publication indicates, this is not a naive exercise in praising AI and Palantir. There is plenty of that going around. Having said that, I want to emphasize that Palantir is an extraordinary company. It has been a slow and bumpy journey in its first 20 years, but Palantir is building powerful defenses to keep competition away.
Palantir is positioning itself as the “operating system for the modern enterprise,” sitting on top of the existing data infrastructure, connecting everything for better decision-making. The narrative and offering are winning a lot of business, with 12-month trailing revenue growing 33.5% compared to a year ago.
The company deploys AI/ML (artificial intelligence and machine learning) techniques across its products. Its domain expertise, especially in the defense industry, combined with advanced analytics, is creating high barriers to entry for competitors. Government business is slow to build but subsequently very difficult to lose.
Palantir has become a darling among investors as a clear example of an AI company that works. The share price is up 484% over the past year, and the company has reached a valuation of USD 292 billion.

The rapidly rising share price has pushed Palantir’s 12-month forward EV/Sales1 ratio to 70.2x, which is the highest multiple on expected revenue that I have ever seen for a mature company with revenue of this size. As of today, it is the second-highest EV/Sales ratio of all U.S.-listed companies with a market value above USD 100 billion.
MicroStrategy has an EV/Sales ratio of 268x, but since this company is merely a holding company for Bitcoin, the metric is useless for MicroStrategy.

The price implied expectations
In the post It is all about free cash flow, I showed a very simple example of how free cash flow is calculated and why this measure is more powerful than the often useless EPS and P/E figures. In the post AI is transforming software companies, we went deeper into discounted cash flow (DCF) models. Today, we go even further, expanding on the concept from the previous post Always invert, where I referenced Expectations Investing by Michael J. Mauboussin and Alfred Rappaport. The concept of inverting the DCF model was a big eureka moment for me. Let’s see how it works with Palantir.
The model below shows the past seven fiscal years of key financial figures. Palantir has grown its revenue from USD 595 million in 2018 to USD 2.87 billion in 2024. At its low point in 2020, the company had negative free cash flow of USD 1.43 billion which grew to USD 302.6 billion in 2024. A quick reader might object and say “Palantir had USD 1.14 billion in free cash flow in 2024” because that is what the cash flow statement says. However, the company had share-based compensation (SBC) of USD 691.6 million in 2024, which is a non-cash expense and thus does not show up in the free cash flow figure on the cash flow statement2. We do not have the time or space today to expand on the arguments for why SBC should be subtracted from the free cash flow calculation. I will instead refer to a post by Aswath Damodaran on the topic.
A stock price today incorporates expectations about the future. That is the important lesson you need to understand. As an investor, you make returns above the discount rate if the company exceeds those expectations.
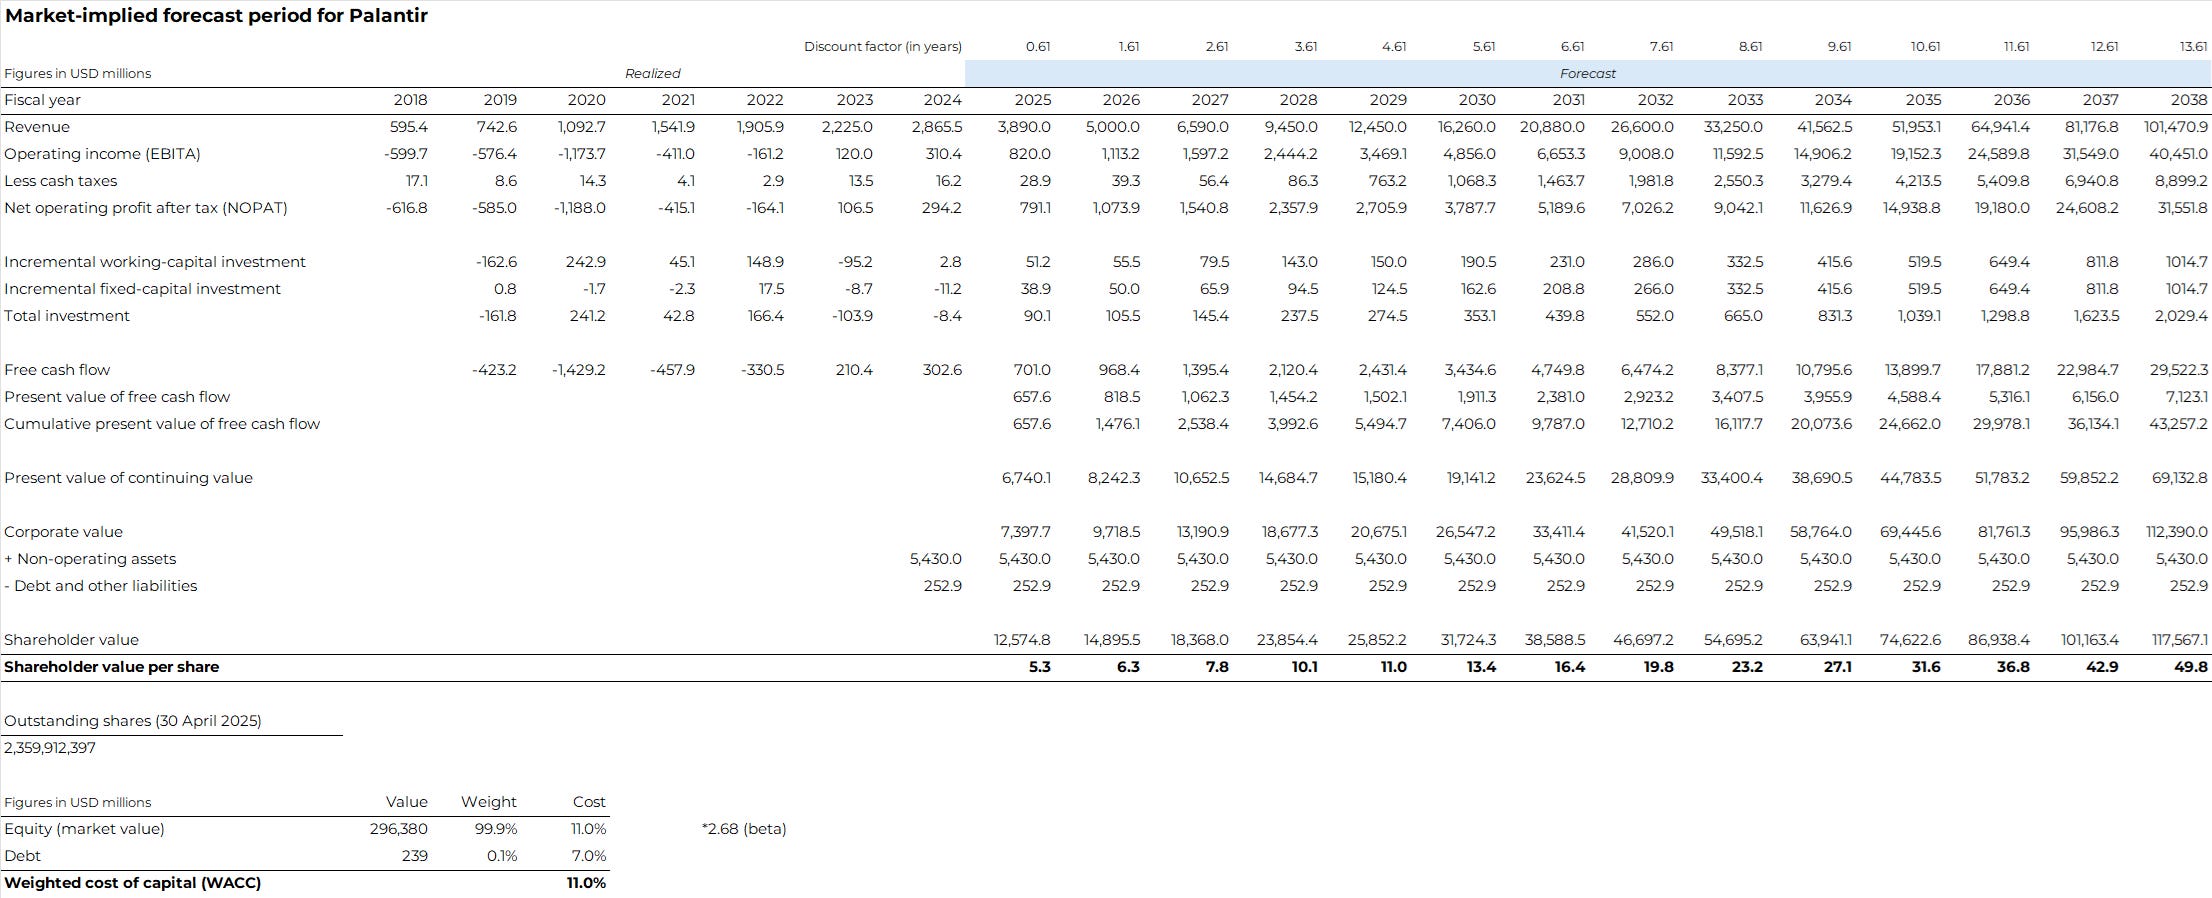
To get the price-implied-expectations for Palantir, I took analyst expectations and forecasted the business almost 14 years into the future. At this point, I could not even justify half of the current valuation. Sales grow at an annualised rate of 30% during this forecasting period with the EBITA3 margin expanding until 2032 before stabilising at 50%. I have assumed very little fixed-capital investment of only 1% and 5% working-capital investment of the net change in sales per year. I have assumed a low cash tax rate of 3.5% (the average in the past seven years) until fiscal year 2029 when I expect the company to have depleted its negative retained earnings reserve. I assume a tax rate of 22% from FY29 and onward.
These assumptions and forecasts lead to NOPAT (net operating profit after tax), total investments, and free cash flow. Next, I invert the process. Normally, an investor would discount cash flows back to today, but here we first calculate the present value of each year’s free cash flow and sum the cumulative value throughout the forecasting period. For each year in the forecasting period, we calculate the continuing value, which is essentially the NOPAT of that year divided by the cost of capital (WACC), which I estimate to be 11%. Next, the cumulative present value of free cash flow is added to the present value of the continuing value to get to the corporate value. Finally, we add the non-operating assets4 and subtract the debt and other liabilities to get to the shareholder value. This figure is finally divided by the total number of outstanding shares. As of 30 April 2025, the total number of outstanding shares was 2,359,912,397.
The general idea of the price-implied expectations model is to forecast as far out as necessary to reach the price you observe in the equity market. This will then give you the forecast length and expectations built into the share price. To achieve future returns better than the discount rate, the company must exceed those expectations. In the case of Palantir, I stopped forecasting because I would not reach the current price unless I projected 30 years into the future.
What is the WACC? It is the weighted average cost of capital and is the discount rate we use on all future free cash flows. Since Palantir has an astronomically high equity valuation, the capital structure (the mix of equity and debt) is 99.9% equity-driven. The cost of debt is straightforward because the effective interest rate on outstanding debt gives the pre-tax cost of debt. The cost of equity5 is not an exact science, but in its simplest form, it can be expressed as the risk-free rate plus an equity risk premium that is multiplied by a sensitivity factor (called beta). In this example, I calculate the cost of equity based on a US risk-free rate of 4.52% (the US 10-year yield), an equity risk premium of 4.33% as estimated by Aswath Damodaran, and a beta of 1.5, which is lower than the estimated beta of 2.68 based on monthly observations over the past five years. I have adjusted the beta downward to match the peer group of enterprise software companies.
The model above could have been more detailed. I could have synthetically capitalised R&D spending to better reflect the real investments and invested capital in the business. I also did not complete the adjustment for options in the calculation of shareholder value. All these things, while theoretically more accurate, would not have meaningfully altered the conclusion. There are many variables in valuing a business outside the DCF model, and sometimes analysts get too detail-oriented, losing sight of the first principles driving the business.
Not even growing 30% annualised for 14 years can justify the valuation
The obvious question for an investor, now that we have an equity valuation model based on expectations and free cash flow, is whether those expectations can be exceeded. In this model, we forecast sales to grow at 30% annualised over almost 14 years, and we still cannot justify Palantir’s share price. We even allow for significant operating margin expansion, settling at a high level, suggesting the company can avoid competitive pressures for over a decade. How realistic are those expectations?
Here, the concept of priors (Bayesian statistics) or base rates comes into the picture. Michael Mauboussin’s paper, The Base Rate Book - Sales Growth, is a valuable statistical analysis to help us judge Palantir. Based on sales growth data from 1994 to 2014, only seven companies had 30% annualized sales growth for 20 years. Around 80 companies delivered this high growth rate for 10 years. For companies with sales the size of Palantir’s, only about 0.2% deliver this type of growth. It could be that Palantir is one of these wonder companies. But let us remind ourselves that even if Palantir is among the 0.2% of companies to achieve this for 15 years, it would still only give you an 11% (the discount rate) annualized return over 15 years. This is a poor risk-reward ratio for a long-term investor.

Why sell-side analysts’ use of valuation metrics is a dead end
The price-implied expectations framework highlighted above gives you a better basis for reading the stock price and for assessing whether the stock price is offering you a good opportunity.
Many analysts simply use a valuation multiple to justify a given price target. For example, an analyst could present many optimistic arguments for the bright future of Palantir and then claim that an EV/EBITDA of 100x in 2027 is justified because of AI and explosive opportunities. With a forward EV/EBITDA of 100x in 2027, the analyst could publish a price target roughly 10% above the current stock price and receive a lot of calls from greedy and perhaps foolish investors.
Valuation-metric-based methods for justifying the value of a stock often become redundant and circular, since an analyst can select whatever metric they want to justify a specific view. In the price-implied expectations framework, we use existing market expectations and forecast out to provide a more unbiased interpretation of what the share price implies about expectations.
It should be noted that, in the case of Palantir, analysts have generally maintained a hold rating for the past two years, and the current consensus price target is around 20% lower than the current share price. Analysts have also been questioning the recent price movement.
Is Palantir the new tulip bubble?
Palantir is a strong company that seems to be doing a lot of things right on AI/ML for both the US government and, increasingly, corporate clients. Despite improving underlying fundamentals, the expectations reflected in the stock price today are extremely high, and the company will most likely never deliver an attractive return for the long-term investor. However, irrational exuberance can continue for a long time, so I cannot exclude the possibility that Palantir’s stock price could inflate even more. But based on my 18 years as a professional in equity markets, I have never encountered anything like Palantir’s valuation, and to some extent it does feel like the old Dutch tulip mania.
Disclaimer: I do not personally own any shares in Palantir or have a short position
The post’s front image (tulip) is from Wai Siew on Unsplash
EV/Sales is the enterprise value to sales ratio. The enterprise value is the market value of equity plus the net debt (interest bearing debt less cash and equivalents).
I will dedicate an entire future post for dealing with share-based compensation.
EBITA stands for earnings before interest taxes and amortization (of acquired intangibles).
In Palantir’s case it consists mostly of cash, cash equivalents, and investment securities in excess of the operating needs.
The cost of equity and the equity premium are huge topics and I will kindly refer again to finance professor Aswath Damodaran.
Will Palantir bleed out like AMC? (Not fundamentally, but in price)
Hi Peter,
Reading this post got me thinking that what if there was added a terminal value to the DCF calculation. I tried to do that with inverting in mind... So what possible CAGR, Operating Margins, and Return on invested capital would be needed to justify the current stock price?
My calculation is summarized in a pdf-file (that I will be happy to send to you if you are currious). In short the CAGR will grow in year two at 46%, the Operating Margins will rise from 21% to 41% from year 1 to year 10, and the Return on invested capital will be at 125% after year 10 and onwards. High expectations indeed!