
Quality traps: As dangerous as value traps
Traps occur because of obsessive focus on the past

Before the summer holiday, I hinted at writing a new piece on a concept called the threshold margin. That article is still in progress, but in the meantime I would like to briefly touch on another concept that is rarely discussed: quality traps — and why they can be just as dangerous as value traps.
What is a quality trap?
The equity investing industry has coined countless labels over the years, most of them tied to quantitative concepts. Value is probably the most famous, going back to the days of Benjamin Graham and his disciple Warren Buffett.
In its earliest form, value investing meant buying stocks priced below their liquidation value — hence the old question: “Is American business worth more dead than alive?” Later on, value was defined more narrowly as simply low price-to-earnings (P/E) and low price-to-book (P/B) shares. As the so-called “factor zoo1” expanded, other labels appeared — momentum, quality, growth, and so forth.
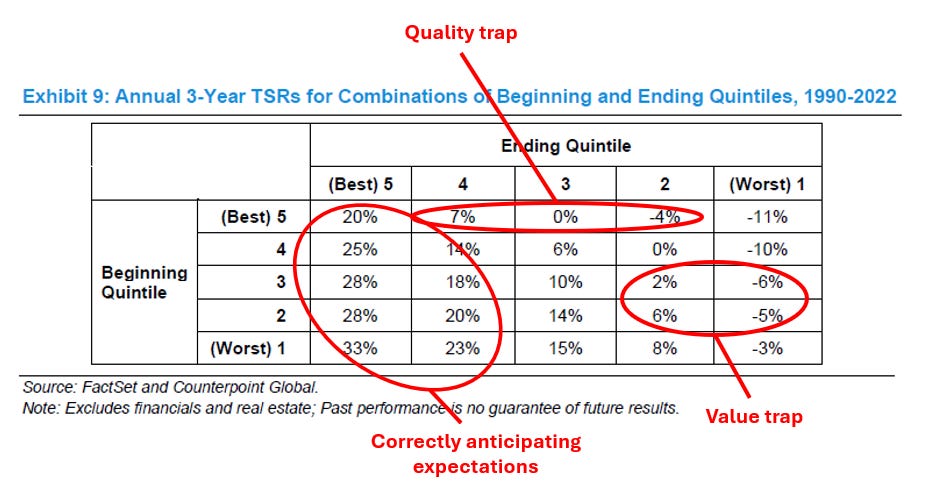
Most investors will be familiar with a value trap. This occurs when you buy a share with a low P/E ratio, often far below the market average, expecting it to mean-revert once business conditions improve. Instead, however, the low P/E reflects a fundamentally broken company. The mistake here is buying purely on a low valuation.
Consider the ROIC (Return on Invested Capital) transition matrix, which shows three-year returns based on changes in ROIC over time. A typical value stock sits at or below the median ROIC level. When the stock proves to be a trap, ROIC declines even further as the underlying business weakens — destroying shareholder value.
Value traps versus quality traps
A quality trap looks very different on the surface, but the result is the same.
Here, the investor buys a high-priced “quality” company — one with high ROIC and respectable growth rates. These metrics indicate strong earnings against invested capital, often the outcome of good historic strategic positioning. These companies usually begin in the top quintile of ROIC.
But after investors purchase at a premium, the company’s strategic advantage erodes. ROIC begins to decline and shareholder value suffers. The mistake lies in overpaying for past quality whilst overlooking present signs of deterioration.
Key warning signs of a quality trap include:
Declining ROIC or margins
Weakening competitive advantages (for example, lower revenue growth than peers)
Poor management decisions on capital expenditure or acquisitions
Disruption from technology or changing regulation
Modern examples include Nokia and Intel.
Past data tells only half the story
The ROIC matrix demonstrates that of the 20% of companies starting in the top quintile of ROIC, only about 20% manage to stay there. The rest slip into lower quintiles, disappointing investors. This shows why simple quality screens are dangerous. Adding filters such as low leverage or high margins does not eliminate the inherent risk.
The same applies to simplistic value investing. It is easy to assemble a basket of low P/B and low P/E shares — but that does not guarantee success. I learnt this lesson first-hand in the years leading up to the 2008 financial crisis.
Where exceptional returns come from
Beyond quality and value traps lies a third path: the rare but powerful ROIC transitions that deliver extraordinary returns.
These are cases where a business starts with very low ROIC (and hence likely trades at a depressed valuation) but transforms into a high-ROIC company. Alternatively, firms that manage to sustain high ROIC over time also generate significant shareholder gains.
Identifying such businesses is the investor’s real challenge. Analysing past financial statements and management performance is straightforward. The hard part lies in assessing the dynamic and shifting strategic position of the company within its market.
Superior returns come from foreseeing changes in expectations ahead of others.
Take Nvidia as an example. The launch of ChatGPT was a pivotal moment. Even after the first surge in its share price, expectations kept rising as investors recognised the impact on GPU demand. Nvidia’s ROIC in the fiscal year just after ChatGPT’s release was 15.9%; less than three years later, it had risen to 80.9%.
The investor’s edge
Past financial metrics are important, but they represent only a fraction of the picture. Future returns depend on understanding where the business is heading.
As ice hockey legend Wayne Gretzky once put it,
“I skate to where the puck is going to be, not where it has been.”
― Wayne Gretzky
The front image used for this article is a photo by David Clode on Unsplash.
Taming the Factor Zoo: A Test of New Factors by Guanhao Feng, Stefano Giglio, and Dacheng Xiu
Great article which touches on a very interesting and understated subject.
I rarely use screenings for companies - often for the same reason as you do. But sometimes, if I lack some companies to look at, I screen for incremental gains in ROIC over time, which then includes companies that are improving.
Is it perfect? No, but it can help get some companies on the radar at least
Hi Peter, there is one more sort of companies. Big reputable corporations with (used to) decent market share which due to series of bad decisions lost the shine. If management introduces turnaround plan and it brings first results typically they are going stable up for longer period of time. It happened to Meta (and Metaverse dream), Siemens Energy and their wind turbine business, whether it will apply to Intel ... we will see.